United State Public Education Spending
- Federal, state, and local governments provide $764.7 billion or $15,120 per pupil to fund K-12 public education.
- The difference between spending and funding is $97.85 billion or $1,935 per pupil.
- The federal government provides 7.9% of funding for public K-12 education.
- Public postsecondary schools spend an average of $28,977 per pupil.
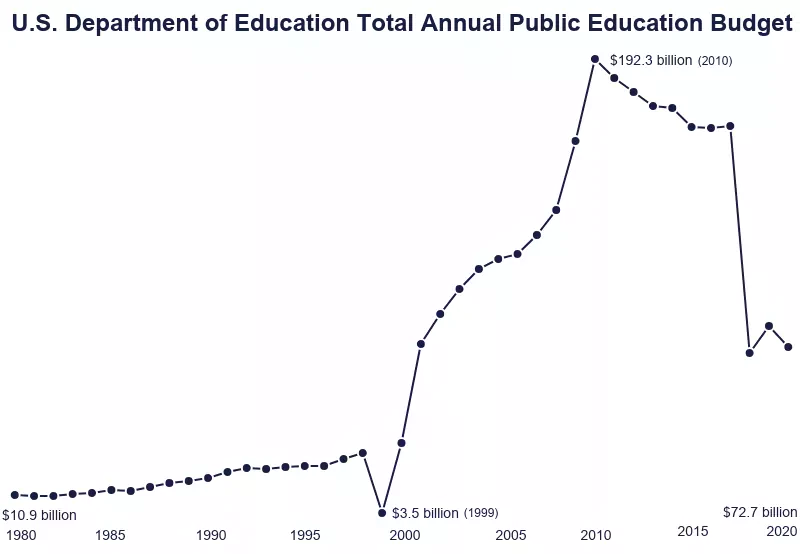
- The national gross domestic product (GDP) grows 71.6% faster than public education budgets.
*Percentage totals do not always equal 100 due to rounding.
Public Education Spending Statistics
Public education spending at the national level services 50.58 million K-12 students and 19.64 million postsecondary students. It is normal for spending totals to undercut public funding totals to a degree.
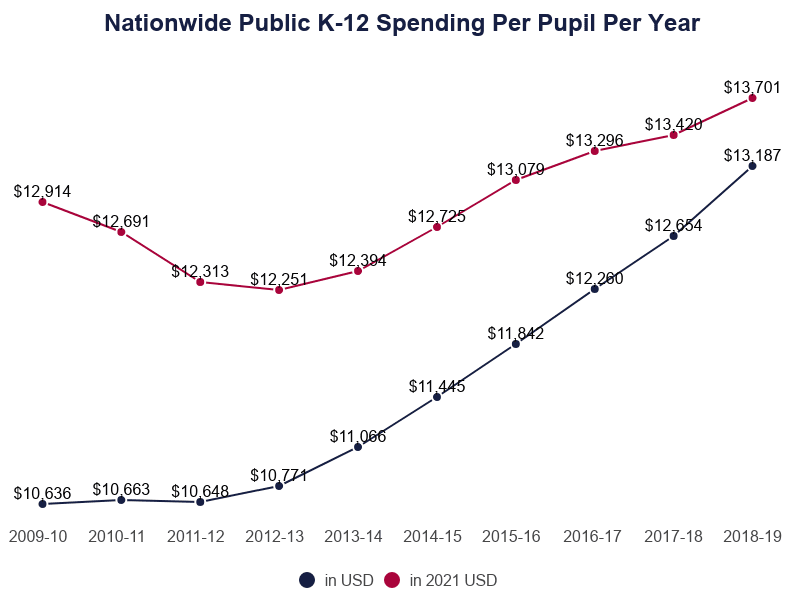
- K-12 public schools spend $13,185 per pupil.
- Public K-12 expenditures total $666.9 billion.
- Expenditures are equivalent to 3.41% of taxpayer income.
- K-12 schools nationwide receive $60.34 billion total or $1,193 per pupil from the federal government.
- States contribute a total of $357.0 billion to K-12 public education or $7,058 per student.
- Local governments contribute $347.4 billion total or $6,868 per student.
- Federal public education funding is equivalent to 0.32% of total taxpayer income.
- State and local funding is equivalent to 3.76%.
- Funding for K-12 education totals $764.7 billion, or $15,120 per pupil.
- The difference between spending and funding is $97.85 billion, or $1,935 per pupil.
- At the postsecondary level, public colleges and universities spend $28,9776 per pupil, 27.5% of which goes toward instruction.
- Federal funding for public postsecondary institutions averages $1,693, down 16.7% year-over-year (YoY). $2,032 per student.
- States and local governments contribute a combined $5,926.
- Tuition accounts for 19.5% of all funding.
- 6.00% of all postsecondary funding comes from sales and services of auxiliary enterprises.
- 2-year public institutions spend 16.3% of what 4-year public colleges spend annually.
U.S. and World Education Spending
In the United States, education spending falls short of benchmarks set by international organizations such as UNESCO, of which the U.S. is a member. The nation puts 11.6% of public funding toward education, well below the international standard 15.00%.
- Schools in the United States spend an average of $16,993 per pupil, which is the 7th-highest amount per pupil (after adjusting to local currency values) among the 37 other developed nations in the Organization for Economic Co-operation and Development (OECD).
- In terms of a percentage of its gross domestic product (GDP), the United States ranks 12th among OECD members in spending on elementary education.
- The United States does not meet UNESCO’s benchmark of a 15.00% share of total public expenditure on education.
- In terms of early childhood education, the United States is one of six (6) countries that do not report any educational spending.
- Luxembourg spends US$22,700 per pupil, which is more than any of the other OECD nations spend on education.
- African nations spend the highest amount on education in terms of a percentage of GDP.
- At 4.96%, the United States spends a smaller percentage of its GDP on education than other developed nations, which average 5.59% of GDP in educational spending.
| Country | Elementary Schools | Secondary Schools |
|---|---|---|
| Luxembourg | $12,892 | $20,413 |
| Korea | $11,047 | $12,202 |
| France | $7,395 | $11,747 |
| Slovenia | $8,542 | $8,290 |
| Spain | $7,320 | $9,020 |
| Mexico | $2,874 | $3,129 |
| Colombia | $3,178 | $2,817 |
| Indonesia | $1,514 | $1,435 |

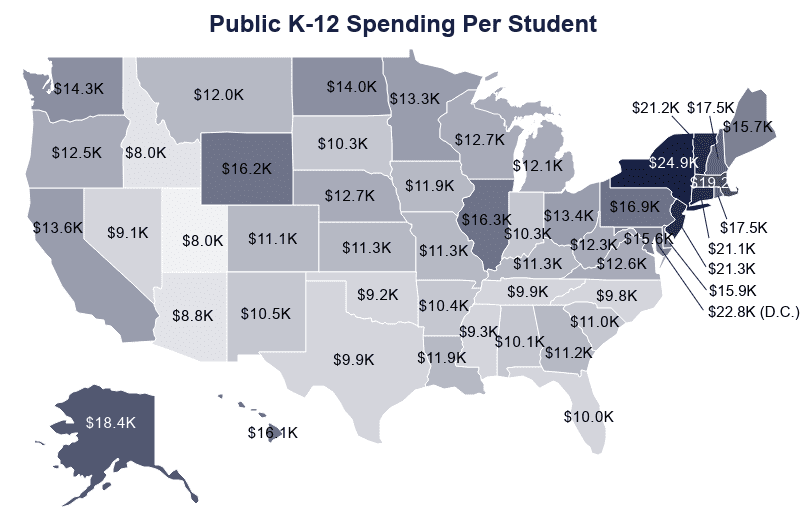
Public Education Spending by State
Education spending refers to the money spent by public schools. This may include teacher and administrator salaries, supplies, building maintenance, field trips, etc. These numbers refer to how much money has a direct impact on public school students.
- New York schools spend the most on K-12 education per pupil.
- California spends the most on postsecondary education.
- New York also spends the second-most on K-12 education in terms of a percentage of local taxpayer income.
- Alaska K-12 schools spend the most in terms of a percentage of taxpayer income.
- District of Columbia K-12 public school students receive the second-most expensive education.
- District of Columbia K-12 schools spend the least in terms of a percentage of local taxpayer income.
- North Carolina makes the most of its funding for K-12 education, having the least funds per pupil leftover after spending on students.
| State | K-12 Spending | Postsecondary Spending |
|---|---|---|
| District of Columbia | $22,832 | $27,142 |
| New York | $24,881 | $33,760 |
| Connecticut | $21,146 | $20,284 |
| Vermont | $21,219 | $31,103 |
| New Jersey | $21,334 | $32,421 |
| Pennsylvania | $16,897 | $18,141 |
| Oregon | $12,460 | $33,289 |
| Hawaii | $16,128 | $39,372 |
| Alaska | $18,392 | $27,266 |
| Washington | $14,348 | $38,416 |
| Massachusetts | $19,193 | $18,813 |
| Wyoming | $16,231 | $33,111 |
| Iowa | $11,935 | $28,380 |
| Delaware | $15,931 | $23,146 |
| New Hampshire | $17,456 | $36,914 |
| Michigan | $12,053 | $22,316 |
| California | $13,642 | $17,946 |
| Maryland | $15,582 | $38,453 |
| Rhode Island | $17,539 | $18,524 |
| North Dakota | $14,037 | $21,746 |
| New Mexico | $10,469 | $38,516 |
| Ohio | $13,437 | $31,465 |
| Illinois | $16,277 | $32,881 |
| Minnesota | $13,302 | $26,646 |
| Kentucky | $11,278 | $27,277 |
| Nebraska | $12,741 | $24,316 |
| Alabama | $10,108 | $21,760 |
| Virginia | $12,638 | $26,561 |
| Colorado | $11,070 | $25,203 |
| Wisconsin | $12,694 | $40,038 |
| Maine | $15,691 | $30,293 |
| South Carolina | $10,991 | $29,045 |
| Utah | $7,951 | $22,187 |
| Montana | $11,983 | $25,055 |
| Kansas | $11,327 | $25,958 |
| Arkansas | $10,414 | $26,246 |
| Texas | $9,871 | $26,102 |
| West Virginia | $12,266 | $20,519 |
| Mississippi | $9,255 | $26,423 |
| Indiana | $10,256 | $41,705 |
| Missouri | $11,349 | $27,160 |
| Louisiana | $11,917 | $30,196 |
| Georgia | $11,203 | $43,420 |
| South Dakota | $10,326 | $21,522 |
| North Carolina | $9,798 | $27,505 |
| Oklahoma | $9,200 | $39,061 |
| Tennessee | $9,942 | $29,665 |
| Arizona | $8,770 | $25,166 |
| Florida | $9,983 | $23,834 |
| Nevada | $9,124 | $34,646 |
| Idaho | $8,041 | $27,760 |

Public Education Funding by State
Educational funding or financing refers to how much money goes into schools, also sometimes referred to as revenue or income. Financing influences spending, but states rarely spend 100% of their public school funding.
- K-12 schools in Alaska receive the most funding per pupil from the federal government.
- The District of Columbia receives the second-most federal funding for K-12 schools.
- Utah receives the lowest amount per pupil from the federal government.
- Colorado receives the second-lowest amount per pupil in federal funding.
- Vermont’s state government spends the most per pupil of any state government to finance education.
- Hawaii supplies the second-most state funding.
- Nevada’s state government supplies the lowest amount of educational financing per pupil.
| State | Federal Funding | State & Local Funding |
|---|---|---|
| Hawaii | $6,128 | $12,116 |
| Alaska | $5,982 | $17,222 |
| Vermont | $5,728 | $6,331 |
| Montana | $4,810 | $7,025 |
| Washington | $4,309 | $8,954 |
| Oregon | $4,260 | $8,515 |
| Colorado | $4,188 | $3,894 |
| Pennsylvania | $4,073 | $5,491 |
| Delaware | $4,068 | $8,192 |
| Michigan | $3,598 | $6,384 |
| Alabama | $3,417 | $7,373 |
| Utah | $3,285 | $6,632 |
| New Mexico | $3,284 | $10,909 |
| Iowa | $3,203 | $7,086 |
| Wyoming | $3,049 | $13,423 |
| Mississippi | $3,045 | $8,325 |
| Nebraska | $3,033 | $11,883 |
| District of Columbia | $2,994 | $21,259 |
| Maryland | $2,852 | $9,783 |
| North Dakota | $2,824 | $8,518 |
| Virginia | $2,690 | $6,120 |
| Wisconsin | $2,671 | $8,638 |
| Georgia | $2,657 | $7,674 |
| South Carolina | $2,520 | $7,157 |
| Kentucky | $2,459 | $5,754 |
| South Dakota | $2,442 | $6,363 |
| Oklahoma | $2,348 | $7,031 |
| Kansas | $2,323 | $7,635 |
| North Carolina | $2,312 | $10,352 |
| Rhode Island | $2,155 | $5,340 |
| Indiana | $2,112 | $6,074 |
| New Hampshire | $2,069 | $5,258 |
| Massachusetts | $2,044 | $9,553 |
| Minnesota | $1,994 | $8,124 |
| Texas | $1,912 | $8,160 |
| Arkansas | $1,895 | $7,249 |
| Illinois | $1,883 | $7,354 |
| New Jersey | $1,875 | $6,739 |
| California | $1,861 | $9,585 |
| Connecticut | $1,831 | $12,040 |
| West Virginia | $1,795 | $7,883 |
| Idaho | $1,757 | $6,888 |
| Arizona | $1,675 | $5,506 |
| Florida | $1,547 | $7,331 |
| Louisiana | $1,527 | $8,706 |
| Nevada | $1,507 | $6,728 |
| Ohio | $1,473 | $5,640 |
| Maine | $1,456 | $7,275 |
| Tennessee | $1,338 | $8,260 |
| New York | $1,126 | $11,778 |
| Missouri | $1,100 | $5,389 |